Key Metrics to Monitor
- User Adoption: Measure how many users actively engage with the system. Aim for 85–90% adoption within 90 days.
- Time Savings: Digital tools automate processes, reducing manual tasks by 64%.
- Cost per Shipment: Track shipment costs to ensure an 18% cost reduction.
- Error Rates: Automation decreases mistakes, improving accuracy and consistency.
- Quote Success Rate: Higher conversion rates from quotes to bookings indicate better customer satisfaction.
- Green Impact: Monitor CO2 emissions and fuel efficiency to reduce environmental impact.
Quick Summary Table
| KPI Category | Goal/Impact |
|---|---|
| User Adoption | 85–90% adoption in 90 days |
| Time Savings | 64% reduction in manual tasks |
| Cost Savings | 18% cost reduction |
| Error Reduction | Lower errors via automation |
| Quote Success Rate | Higher bookings from quotes |
| Green Impact | Reduced emissions and fuel use |
Digital freight tools simplify processes, improve efficiency, and help businesses grow. Start tracking these KPIs to measure your success.
Core KPIs for Digital Freight Projects
The success of digital transformation in freight projects hinges on tracking the right performance indicators. These metrics provide the framework to evaluate and enhance the outcomes of freight digitalization efforts.
User Adoption Metrics
User adoption measures how widely a digital freight system is embraced by its intended users. It’s calculated as:
User adoption = (Active users / Total potential users) × 100
Here’s a look at typical adoption benchmarks:
| Implementation Phase | Expected Adoption Rate | Timeline |
|---|---|---|
| Initial Rollout | 30–40% | First 30 days |
| Intermediate Stage | 60–70% | 60–90 days |
| Mature Implementation | 85–90% | 90+ days |
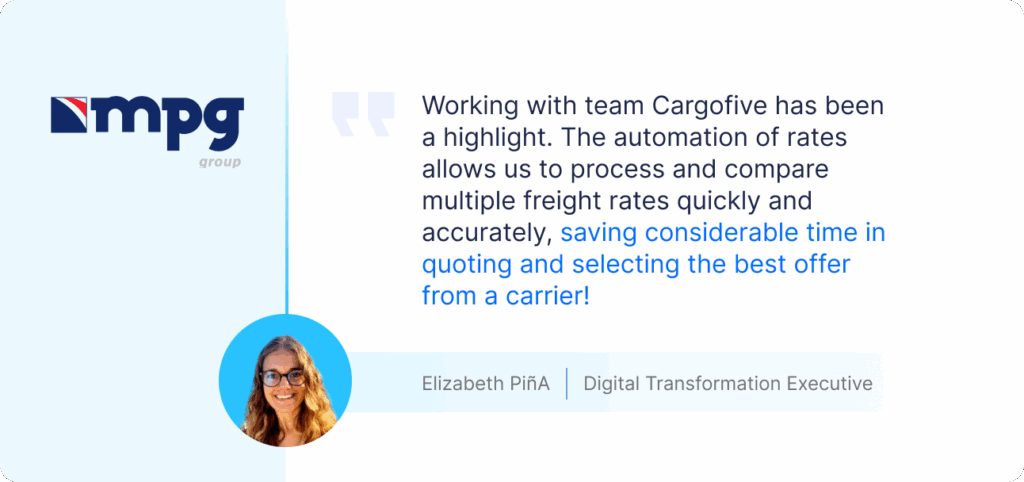
For example, a freight forwarder using Cargofive achieved a 92% adoption rate within three months. This success was driven by closely monitoring usage patterns across departments and addressing resistance early on.
Setup Time Analysis
The typical timeline for implementing a digital freight system is 6–8 weeks, from selection to deployment. This process generally includes:
- System configuration: 1–2 weeks
- Testing: 2 weeks
- Training: 1–2 weeks
- Pilot run: 2 weeks
When this timeline is followed, freight forwarders often report a 23% boost in operational efficiency during the first quarter of implementation.
Staff Training Progress
Reaching 80% staff competency is a critical milestone for successful digital transformation. Training progress is tracked using metrics such as module completion rates, competency tests, and practical evaluations. The goal is to achieve:
- 50% basic proficiency
- 70% intermediate proficiency
- 85–90% advanced proficiency within 90 days
Recent data shows that 73% of carriers now rely on AI-driven training platforms. These platforms tailor content to individual performance, helping staff develop skills more effectively.
Process Improvement KPIs
Process improvement KPIs go a step further than basic operational metrics, offering a clear way to measure the benefits of digital transformation in freight management. These indicators help freight forwarders evaluate efficiency improvements, pinpoint operational gains, and uncover areas that could use further refinement.
Error Rate Reduction
Reducing error rates is a key advantage of digital automation. By cutting down on mistakes caused by manual processes, digital tools improve both the consistency and quality of freight management operations. This boost in accuracy doesn’t just streamline workflows – it also contributes to measurable savings, such as lower costs per shipment.
Cost per Shipment Analysis
Cost per shipment analysis provides a straightforward look at the financial benefits of digital transformation. This KPI is calculated by dividing total shipment costs by the number of shipments, making it easy to track expense reductions over time. Digital tools play a big role here, driving cost savings by improving rate management, automating documentation, and streamlining processes. For instance, platforms like Cargofive offer real-time monitoring tools to keep track of these metrics, ensuring continuous optimization.

Customer Service KPIs
After assessing process improvement metrics, customer service KPIs provide another lens to evaluate how digital tools elevate the freight customer experience. These tools are becoming essential for setting new standards in customer service within freight management.
Quote Success Rate
This metric tracks how well digital solutions turn quotes into confirmed bookings. A higher rate suggests that the platform delivers accurate and competitive quotes that align with customer expectations.
Digital platforms play a key role here by offering instant rate access and automating calculations. For example, Cargofive users have reported noticeable gains in quote processing efficiency thanks to their ability to view comprehensive rates across various carriers. This improvement highlights how automation can directly enhance customer satisfaction by simplifying and speeding up the quoting process.
Service Response Speed
Response speed measures how quickly customer inquiries are handled, quotes are processed, and shipment updates are provided. While the industry standard often aims for a 24-hour response time, digital tools are enabling much faster results.
Modern freight management platforms can help forwarders save up to 64% of their time by providing instant access to critical data and automating repetitive tasks. Cargofive, for instance, improves operational efficiency by consolidating contract and pricing information, making it easily accessible and fostering customer trust.

Green Impact KPIs
As freight forwarders increasingly adopt digital transformation, the ability to measure and reduce environmental impact has taken center stage. Digital tools now offer precise methods to monitor and improve ecological footprints across logistics operations.
Route Emissions Data
Advanced digital systems make it possible to track carbon emissions with precision, thanks to improved route planning technologies. These platforms can pinpoint routes that lower emissions without compromising efficiency.
With digital route planning, freight forwarders can:
- Monitor CO2 emissions per mile to assess environmental efficiency.
- Track overall carbon footprint reductions across operations.
- Analyze route-specific environmental data to identify areas for improvement.
- Compare carriers’ environmental performance to make informed choices.
For example, Cargofive’s integration with major carriers provides detailed visibility into schedules and routes. This allows forwarders to choose shipping options that align with environmental priorities. By systematically optimizing routes, companies have seen measurable reductions in emissions.
Fuel-related metrics further highlight the environmental advantages of digital freight systems.
Fuel Usage Metrics
Digital tools also bring precision to fuel consumption monitoring and optimization. By leveraging real-time data and advanced analytics, companies can track fuel efficiency across their operations and uncover opportunities for improvement.
The results of digital optimization in this area can be profound. For instance, users of Cargofive have reported up to an 18% reduction in total costs by improving operational efficiency through these tools.
Some key fuel usage metrics include:
- Gallons per route mile: A direct measure of fuel efficiency for specific routes.
- Monthly fuel consumption trends: Tracks ongoing progress in fuel optimization efforts.
- Carrier fuel efficiency comparisons: Highlights differences in performance among carriers.
By integrating with carrier systems, digital platforms provide freight forwarders with comprehensive data to guide decision-making. This data-driven approach helps companies:
- Select fuel-efficient routes.
- Optimize container usage to maximize capacity.
- Minimize empty miles, reducing wasted fuel.
- Track fuel savings over time to measure progress.
These green KPIs, when combined with operational and customer service metrics, provide a well-rounded view of digital transformation success in the freight industry.

Measuring Digital Success with KPIs
Freight forwarders can effectively measure digital success by closely tracking a range of key performance indicators (KPIs). By keeping a sharp focus on these metrics, companies can translate digital transformation efforts into tangible results, as seen in successful examples across the industry.
The influence of KPI-driven digital transformation goes far beyond surface-level metrics. Digital tools have simplified processes like rate management and contract handling. This has empowered freight forwarders to make smarter, data-backed decisions that improve overall efficiency. These advancements have reshaped traditional freight operations, creating businesses that are agile and digitally focused.
Some of the critical areas freight forwarders can monitor through KPIs include:
- User adoption and improved process efficiency
- Quote success rates and faster response times
- Emissions data and environmental impact
- Operational cost reductions
The secret to achieving lasting success lies in centralizing data and maintaining consistent KPI tracking.
With over 71 freight forwarders worldwide embracing digital transformation and reporting significant growth, it’s clear that focusing on the right KPIs is a must for thriving in today’s freight industry.
FAQs
What strategies can freight forwarders use to boost user adoption of digital tools?
To boost user adoption, freight forwarders should prioritize simplicity, proper training, and open communication.
Start by choosing intuitive digital tools that fit effortlessly into your current processes.
For example, platforms like Cargofive simplify freight rate management and quoting, making the shift to digital tools much easier.
Offer thorough training sessions to ensure your team fully understands how to use the new tools and recognizes their value.
Customize these sessions based on different roles within your organization to address specific responsibilities and challenges.
Alongside training, maintain transparent communication about the benefits these tools bring – like increased efficiency, fewer errors, and time savings.
When employees see how these changes directly improve their work, they’re more likely to embrace and actively use the platform.
What are the best ways to track and minimize errors in freight management?
To keep mistakes in freight management to a minimum, incorporating digital tools is a game-changer.
Tools that provide real-time data tracking and integrate seamlessly with systems like ERP or TMS can ensure accurate, up-to-the-minute information throughout the entire freight process.
Another key step is to automate repetitive tasks like rate management, contract handling, and quoting.
Automation not only cuts down on manual errors but also boosts overall workflow efficiency.
On top of that, keeping an eye on key performance metrics – such as error rates, shipment delays, and cost discrepancies – can help identify problem areas.
This way, you can make proactive changes before small issues grow into bigger problems.
How do digital freight systems help reduce the environmental impact of logistics?
Digital freight systems are making a big impact when it comes to reducing the environmental impact of logistics.
By using real-time data and automation, these systems help optimize routes, cut down on empty miles, and improve load efficiency – all of which lead to lower fuel use and fewer greenhouse gas emissions.
On top of that, digital tools offer valuable insights into operational inefficiencies, allowing companies to adopt practices that are better for the planet.
Take platforms like Cargofive, for example.
They simplify freight rate management and integrate seamlessly with shipping lines, cutting back on manual tasks and reducing paper waste.
This shift not only makes operations smoother but also supports greener logistics.

AUTHOR


